2. Notebook
2.1 Description
The Logbook screen gives you quick and concise access to a lot of accurate and specific information about your diabetes. It is in the form of a double entry table so that each box represents a time in the day on a certain date.

2.2 Adding values and notes
2.2.1 Adding Values
In the Notebook screen, you can write down, according to time and date, different information such as your blood glucose, insulin doses, resuggestions etc... There are two ways to add new values to your logbook. The first one is in the Today screen. Press the button like below:

You can then, through the different fields, from top to bottom, set the date, time of day, time of day, place labels, add a blood glucose measurement, add a postprandial blood glucose measurement, add a blood glucose trend, record fast and slow insulin doses, record an amount of carbohydrates ingested, and record a re-sugar count. Once you have added the information you want, save it. It will then be displayed directly at the date and time period you specify in the Logbook screen.

The second method of entering data into the notebook consists, directly from the Notebook screen, of pressing the box corresponding to the date and period for which you want to enter information and adding in the entry screen that appears said information which will then be displayed from the Notebook screen.
2.2.2 Adding notes
It is sometimes useful to annotate certain boxes, for example, to remember information that has not been planned to be displayed. To do this, simply hold your finger down on the box you wish to annotate, then press the note edit button.
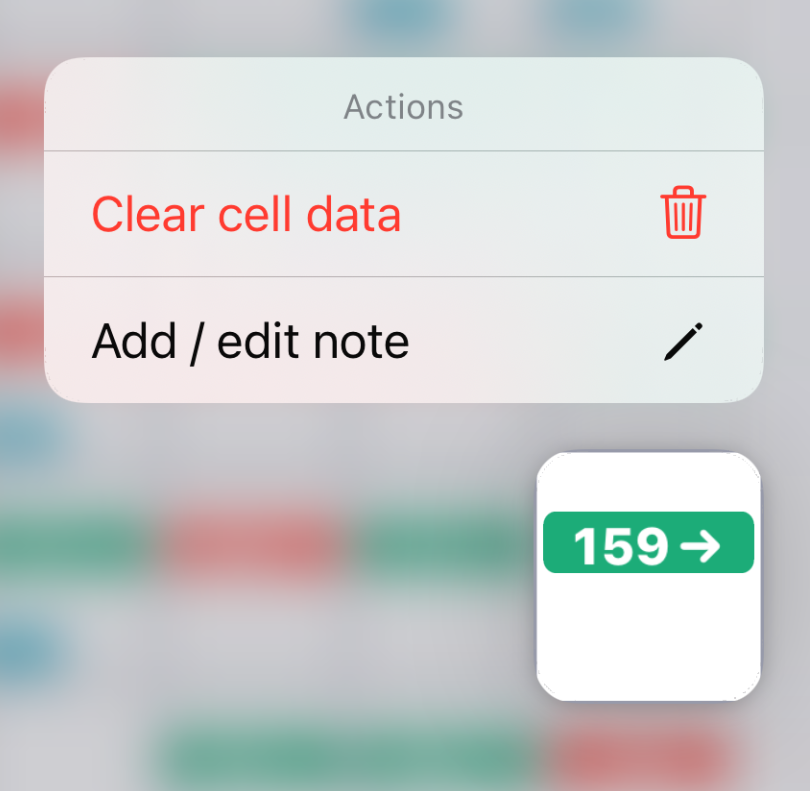
You will then be able to leave the desired note and then save it.

2.3 Reading your notebook
Now that you have entered your first data into your notebook, it is necessary to understand how that information is displayed.
2.3.1 Moving around in the notebook
First of all, the boxes in the notebook represent the different periods of a day. Each row corresponds to a period of the day such as breakfast, lunch or night... The columns represent whole days. It is possible to change the date currently displayed by pressing the date between the arrows and then selecting the desired date.

It is also possible to change the date displayed by pressing the arrows. The single arrows will move you one day forward or backward in time, the double arrows they will move you one month forward or backward. Finally, you can move four days by sliding your finger to the left or right of the notebook.
2.3.2 Reading the logbook information
Here is a box displaying containing different information to help you understand it better:

Let's start with the top part of the box: The man represents the physical activity performed at that time of day. A color code allows you to see if the effort was higher, comparable or lower than your average activity at that time of day:
- Green: below average effort
- Yellow : average effort
- Red : above average effort The cube indicates a rebreathe. A color code indicates the number of rebreaks:
- Green : one resucking
- Yellow : two re-sugarings
- Red: three or more refills The purple label indicates that you have attached one or more labels to the box. The red page shows that you have annotated the box.
Let's continue with the line below: The number on the left is the blood glucose measurement, the arrow is the trend, and on the right is the postprandial blood glucose measurement. A color code allows you to understand if the blood glucose measurements are within your blood glucose target:
- Green: the measurement is within your blood glucose target
- Purple : the measurement is below the glycemic target
- Red : measurement is above the glycemic target
The next two rows can be customized to display up to four of the following information:
- Fast insulin : dose of fast insulin injected at this time of day.
- Slow insulin: dose of slow insulin injected at this time of day.
- Insulin Mix: If you are using an insulin mix, the dose of insulin injected at that time of day.
- Carbohydrate: Carbohydrate dose in grams (only if you enter your carbohydrate doses in grams).
- Oral Medications #1-4: dose of oral medications taken at that time of day, up to four different oral medications can be counted.
It is possible to customize the medications you take in the Treatments tab of the Settings and how you fill in your carbohydrate doses in the Diabetes Basic Settings tab of the Settings. If you choose to fill in your carbohydrate doses by levels, then the information in the logbook will be displayed in the box border according to the following color code:
- Light blue: much less carbohydrates than usual
- Dark blue: a little less carbs than usual
- Black: as many carbs as usual
- Light red: a little more carbs than usual
- Dark red: many more carbs than usual
Finally, you can select what information to display on the last two rows of your logbook boxes in the Customize logbook tab of the settings.